Seismic wave conversion response spectrum with source code attached
Seismic wave conversion response spectrum with source code attached
Official Account: Non-Deconstructive · Author: Zhou Wenqi (Venchy)
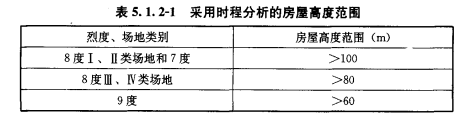
5.1.2 of the Building Seismic Design Code (GB50011-2010, hereinafter referred to as the Code) stipulates that for particularly irregular buildings, Category A buildings, and high-rise buildings within the height range listed in Table 5.1.2-1, the time history analysis method should be used to perform supplementary calculations under frequent earthquakes;
The corresponding article notes that the correct selection of the input earthquake acceleration time history curve must meet the requirements of the three elements of ground motion, that is, the spectrum characteristics, effective peak value and duration must all meet the regulations. Among the requirements for spectral characteristics, it is required that the seismic waves selected in the time history analysis are consistent with the response spectrum of the resistance gauge in a statistical sense, that is, the average seismic response coefficient curve of multiple groups of time history waves is compared with the seismic influence coefficient curve used in the mode decomposition response spectrum method. The difference at the period point corresponding to the main mode shape of the structure is no more than 20%. In previous non-deconstruction articles, the related concepts of seismic waves have been introduced (talk about seismic waves, understand seismic waves in one article, it is worth collecting!, Python crawler practice - automatically download seismic wave time history from the Pacific Earthquake Engineering Research Center database, should you run or avoid the nearest earthquake?). So, how to generate the earthquake corresponding coefficient curve?
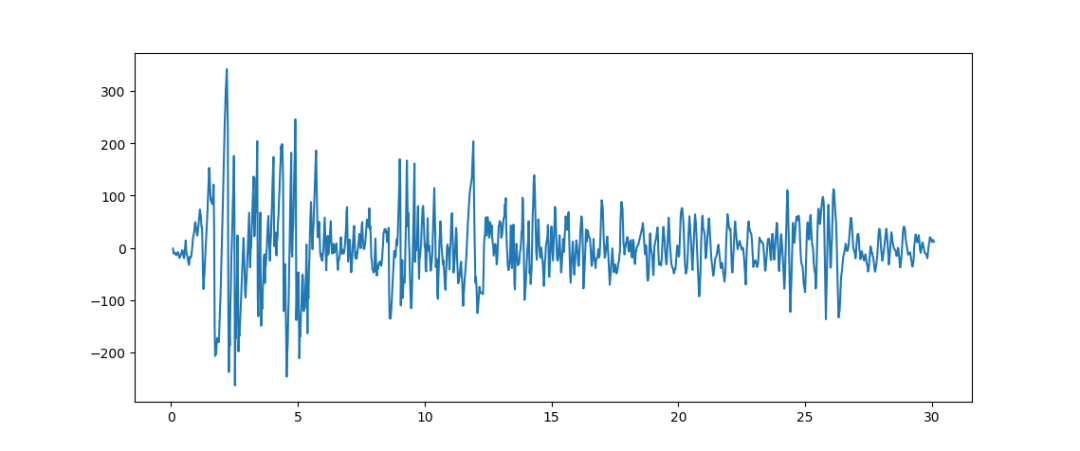
- Generation of single seismic wave response spectrum The response spectrum is a function graph of the peak value of a certain reaction quantity as the natural vibration period Tn of the system, or related parameters such as circular frequency ωn (or cycle evaluation rate fn). Serves as a practical tool to describe ground motions and their structural effects. It provides a convenient way to generalize the peak response of all possible linear single-degree-of-freedom systems to a specific component of ground motion. Response spectrum was introduced by M.A. Biot in 1932 and applied to earthquake resistance by Housner in the 1940s. In the late 1950s, Professor Liu Huixian introduced the response spectrum theory when compiling my country’s first seismic code, pioneering the application of response spectrum in my country’s seismic code. Below we will use a practical example to explain what a response spectrum is and how it is generated. We use the ELCENTRO wave as our case object to illustrate the calculation process of the response spectrum of the ELCENTRO wave. The following is the time history curve of the ELCENTRO wave (the following solution process assumes that the damping ratio is 5%):
Back to the most basic structural dynamics equation for solving the time history response of a single degree of freedom system:

其中m为质量,c为阻尼,u为反应位移,为反应速度,为反应加速度,P(t)为地震波时程。 First, we need to solve the reaction time history of the single-degree-of-freedom system when each seismic wave acts on any single-degree-of-freedom system. Based on the theory of structural dynamics, for an arbitrary excitation single degree of freedom system, its time history response can be solved using Duhamel integral:

下图所示为小编利用杜哈梅积分求解将ELCENTRO波作用在不同的单自由度体系上的时程反应:
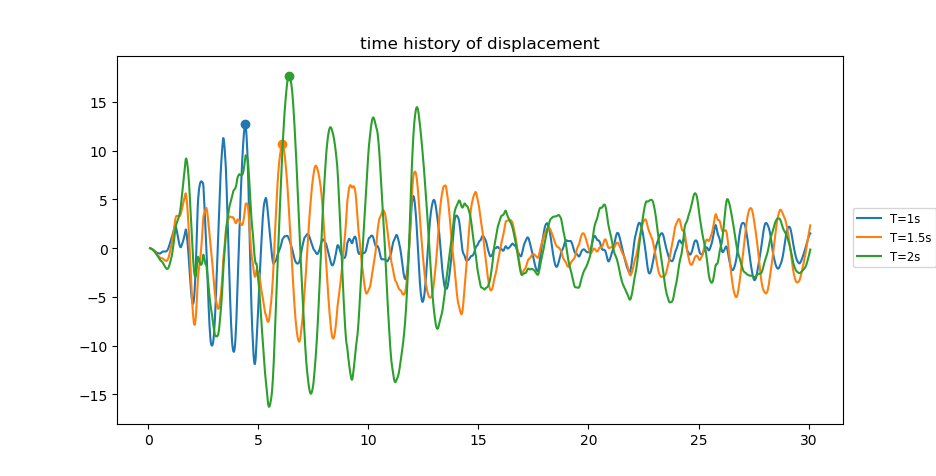
It can be clearly found that when ELCENTRO waves act on single-degree-of-freedom systems of different periods, the peak response of each time course is different, and the time points at which the peaks occur are also different. It is assumed that the period range of the response spectrum is 0-6s. As long as we divide this period range according to a certain time step, we can separately solve the response of the single-degree-of-freedom system corresponding to each period point under the action of ELCENTRO waves. Extract the peak value of each reaction time course, take the period point as the horizontal axis, and take the time course response peak value corresponding to each period point as the vertical axis to form a curve. The curve formed in this way is the response spectrum curve of ELCENTRO. As shown below is the displacement response spectrum curve of the ELCENTRO wave. It represents the peak displacement of single-degree-of-freedom systems of different periods under the action of ELCENTRO waves.
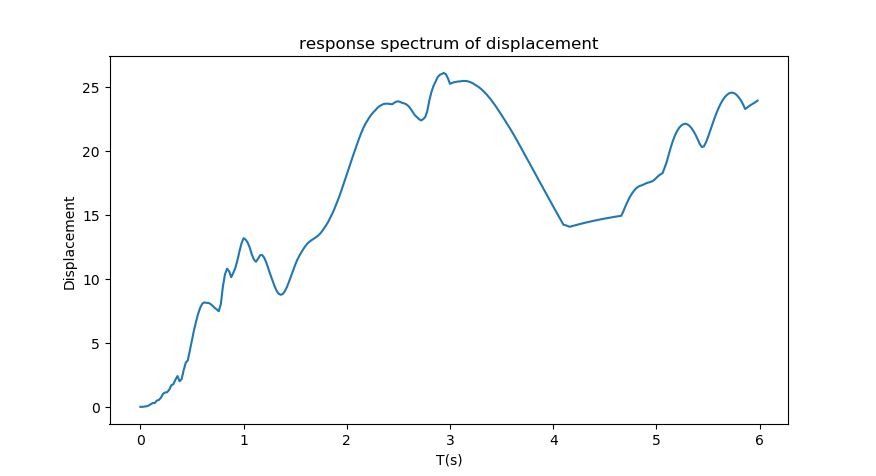
- Displacement spectrum, pseudo-velocity spectrum, pseudo-acceleration spectrum When you see the above response spectrum, you may have doubts like: Is the response spectrum like this? With so many over-limit reports, the peaks of the response spectrum seem to be in the short period part. Why does this response spectrum look so strange? This involves the concepts of displacement spectrum, pseudo-velocity spectrum and pseudo-acceleration spectrum. In the basic equations of structural dynamics and the Duhamel integral, the basic problems to be solved are the displacement of the time history response. The seismic influence coefficient curve in the resistance code and the time history response spectrum curve required in the over-limit report are all based on the acceleration spectrum. So how to convert the displacement spectrum and acceleration spectrum? Let’s look at solving the displacement time history expression of a single degree of freedom system:

It is easy to derive expressions for velocity and acceleration from this displacement expression:
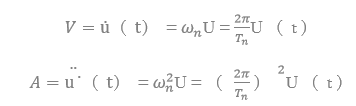
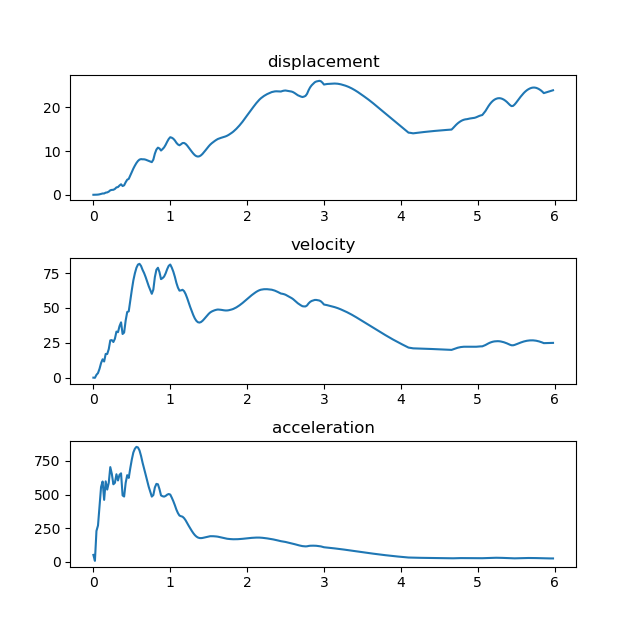
V here is called pseudo velocity, and A is called pseudo acceleration. According to the corresponding formulas, the displacement, pseudo-velocity and pseudo-acceleration response spectrum curves of the ELCENTRO wave are obtained respectively. It can be found that the peaks of pseudo-acceleration, pseudo-velocity, and displacement response spectra are at different stages. When the structural period is short, the response spectrum has an acceleration response peak, and the structure is more sensitive to acceleration. This area is called the acceleration sensitive area; when the structural period is large, the structure has a displacement response peak, and the structure is more sensitive to displacement. This area is called the displacement sensitive area; and between the displacement sensitive area and the acceleration sensitive area, the peak of the velocity response spectrum appears, and this area is called the velocity sensitive area. The definition of acceleration sensitive area, displacement sensitive area and velocity sensitive area is of great significance for judging the structural response under various periodic conditions.
3、求解地震动时程响应的三种方法 Solving the response time history of the structure under a single degree of freedom system based on Duhamel integral is the basis for calculating the response spectrum. Through the collection of data, the editor summarized three ways to solve Duhamel integral. (1) Solve the Duhamel integral through convolution. In functional analysis, convolution, spin product or fold (English: Convolution) is a mathematical operator that generates a third function from two functions f and g, which represents the area of the overlapping portion of functions f and g that have been flipped and translated. Assume: f(x), g(x) are two integrable functions on R1, perform integration:
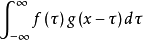
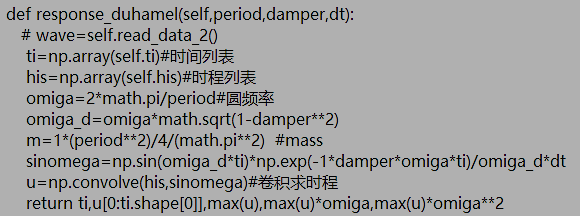
It can be proved that the above integral exists for almost all real numbers x. In this way, with different values of x, this integral defines a new function h(x), which is called the convolution of functions f and g, recorded as h(x)=(f*g)(x). Looking at the form of the Duhamel integral, it is in the form of a convolution integral. Using the convolution integral function that comes with Numpy in python, the corresponding response curve can be obtained. The source code is as follows:
(2) Solve the seismic wave time history from the time domain to the frequency domain through Fourier transform This method is the most misunderstood method for solving seismic wave time history. Many friends will mistakenly think that the response spectrum of seismic waves is simply the curve of the frequency and amplitude of the Fourier function obtained by Fourier transform of the seismic waves. However, friends who think this way are still too yong too naïve. For a constant parameter linear system, when a steady-state simple harmonic input is excited, the steady-state response must also be a simple harmonic output with the same frequency, but its amplitude and phase change.

Represent the abbreviated function as a complex exponential:
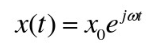
The steady-state output can be expressed as a complex exponential H() domain input
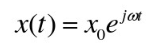
The product of:
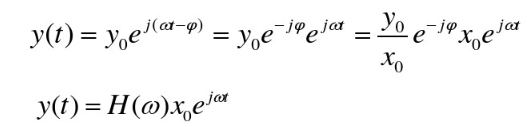
Use the complex number H() to represent the amplitude ratio y0/x0 and phase of the output and input. The complex number H() describes the dynamic characteristics of the linear system in the frequency domain, which is called the frequency response function, or frequency response function for short. It is the response to a unit simple harmonic input. Take a single degree of freedom system subject to sinusoidal excitation as an example: 设:

带入方程:

get:
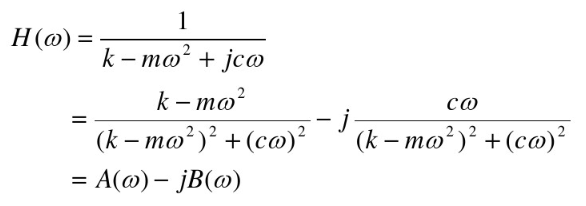
The real part A() and the imaginary part B() are called the real frequency characteristics and imaginary frequency characteristics of the frequency response function.
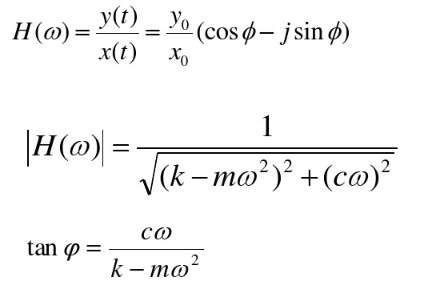
The mode and phase of H() are called amplitude-frequency characteristics and phase-frequency characteristics respectively. Similarly, under the action of impulse force, the impulse response function of the system is:
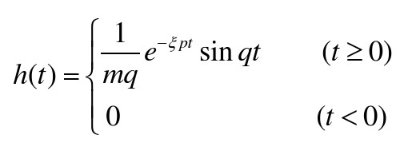
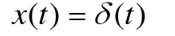
The frequency response function H() describes the response of the system to a unit simple harmonic input; The impulse response function h(t) describes the response of the system to a unit impulse input. Assuming unit pulse input:
Assume the impulse response function:
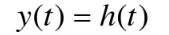
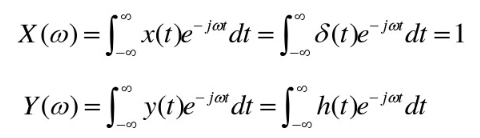
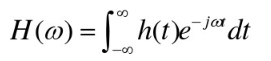
Perform Fourier transform respectively:
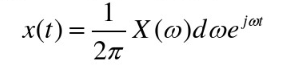
For the time domain waveform of the simple harmonic component input within a certain frequency range d, it is:
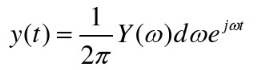
For the time domain waveform of the simple harmonic component output within a certain frequency range d, it is:
but:
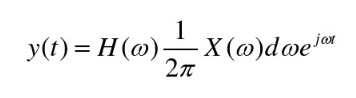
get:
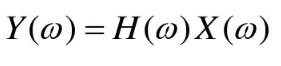
It can be seen that for any non-periodic input, the frequency response function is equal to the ratio of the Fourier transform of the input in the Fourier transform domain of the output. The frequency response function obtained is the Fourier transform of the impulse response function.
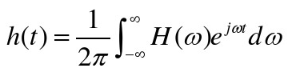
The impulse response function is the inverse Fourier transform of the frequency response function:
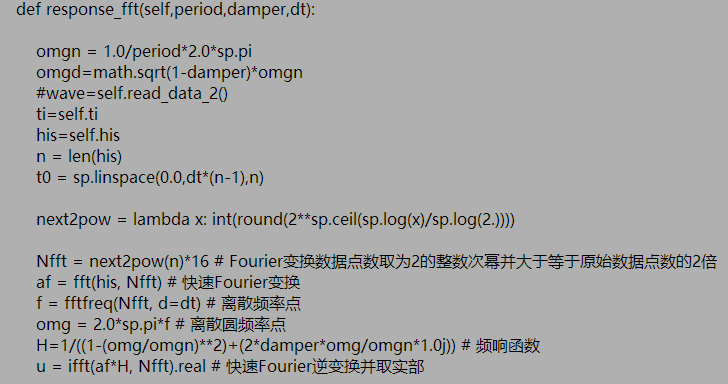
Based on the above derivation, write the corresponding time course code:
(3)根据New-Mark法求地震波时程。 The New-Mark method is a time-stepping method, which is mainly based on the following formula:

Its calculation process is as follows:
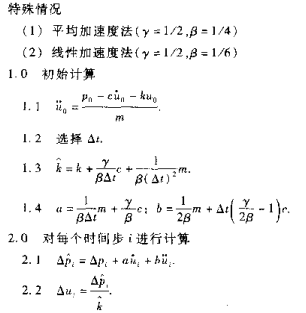
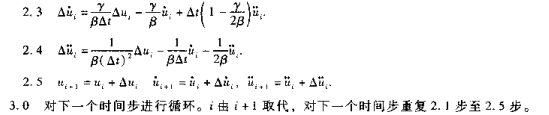
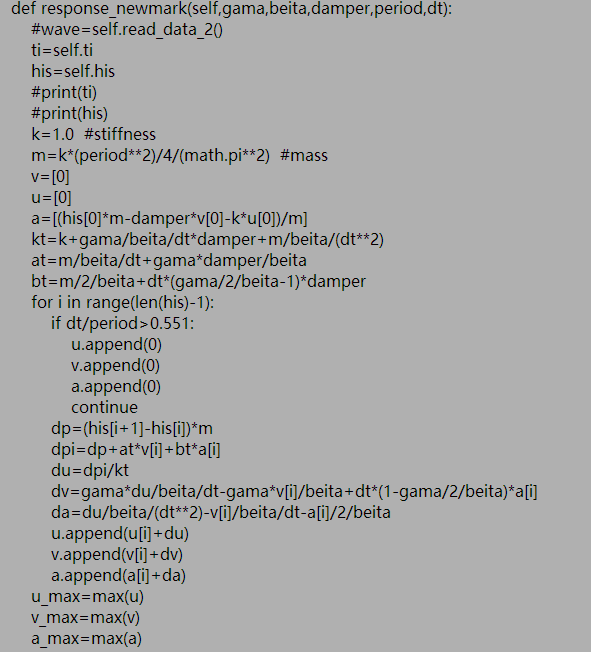
The following is the code for the New-mark method:
According to the above three methods, solve the time history response curve of the ELCENTRO wave system with a natural vibration period of 1s under the same damping:
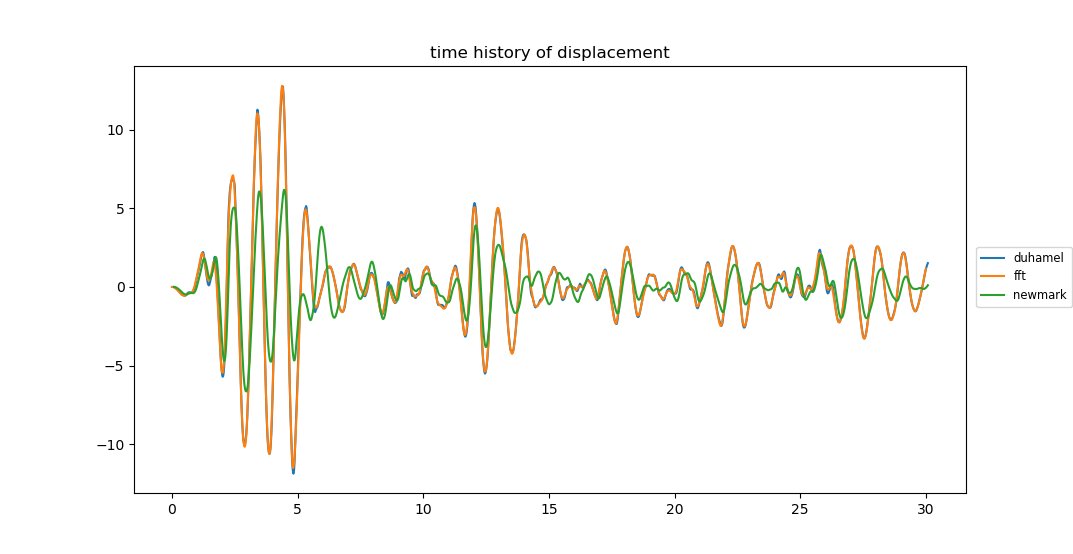
It can be found that the time history curves obtained by the convolution and Fourier transform methods basically overlap, but the results obtained by the new-mark method deviate greatly from the results obtained by the other two methods. 相同的结果同样反映在利用三种方法生成的反应谱曲线中:
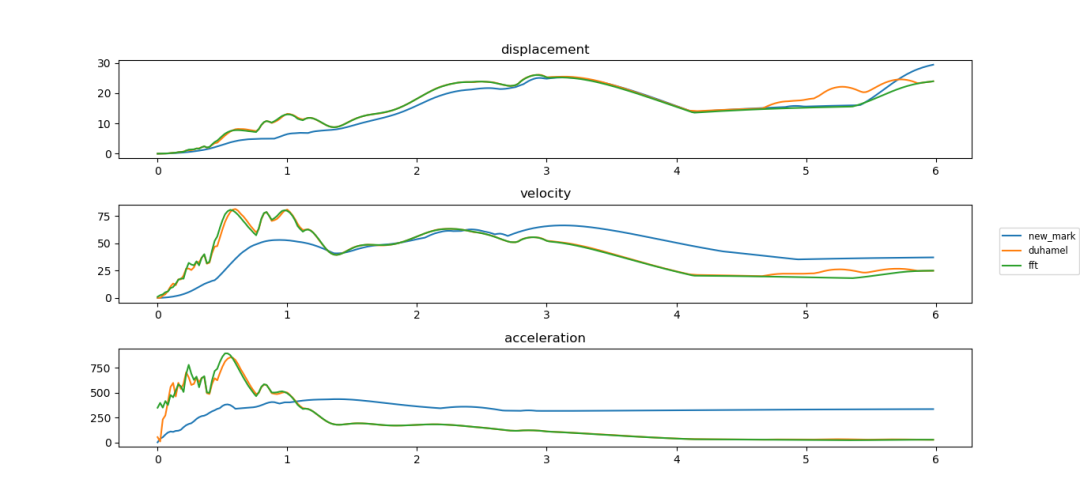
It can be found from the above figure that the displacement spectra obtained by the three methods basically overlap, but the difference between the velocity spectrum and acceleration spectrum obtained by the new-mark method and the other two methods is obvious. This is because during the calculation process, the speed and acceleration of the new-mark method are directly generated during the calculation process and participate in the iteration. In the other two methods, pseudo velocity and pseudo acceleration are used to calculate the displacement. 4. Response spectrum of mode decomposition response spectrum method Research has found that earthquake characteristics are affected by many factors, such as magnitude, epicentral distance, site category, source characteristics and propagation path, etc. Among them, magnitude, epicentral distance and site category have a greater impact on the response spectrum. The response spectrum in the field of seismic design of buildings in my country has been passed through the 1959 “Building Code for Earthquake Areas (Draft)”, the 1964 “Building Design Code for Earthquake Areas (Draft)”, the 1974 “Seismic Design Code for Civil Buildings in Industrial Areas” (TJ11-74), the 1978 “Seismic Design Code for Civil Buildings in Industrial Areas” (TJ11-78), the 1989 “Building Resistance Design Code” With the continuous development of the “Seismic Design Code for Buildings” (GBJ11-89), the 2001 “Seismic Design Code for Buildings” (GB5001-2001) and the 2010 “Code for Seismic Design of Buildings” (GB5001-2010), the main influencing factors of the response spectrum are taken into account, and the definition of the normative response spectrum is continuously improved through statistical fitting of numerous actual response spectra. The response spectrum curve determined based on factors such as site type and intensity can reflect the spectral characteristics of actual earthquakes at the architectural design site. The time history analysis requires that the seismic waves selected in the time history analysis be consistent with the response spectrum of the resistance gauge in a statistical sense. The significance is that the selected seismic waves meet the seismic characteristics of the actual site and are as close as possible to the seismic waves when the actual earthquake occurs. 抗规中归档的结构所受水平地震力可按以下公式表示:
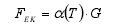
in:

is the acceleration amplification coefficient spectrum; k is the seismic coefficient. Also known as the standardized response spectrum, it is the ratio of the earthquake acceleration response spectrum to the earthquake acceleration peak value am. That is, it represents the amplification factor of the structural response to the earthquake peak value. It is actually a regularized response spectrum. When the ground motion PGA is different, the response spectrum Sa has a larger difference and is not comparable, but the amplification coefficient spectrum is comparable. Therefore, the spectral shape under each influencing factor can be compared and analyzed, making it easier to statistically analyze the characteristic parameters of the response spectrum. References:
- Anil K. Chopra. Structural Dynamics: Theory and Applications in Earthquake Engineering (2nd). Higher Education Press
- Shen Jumin. Earthquake-resistant engineering. China Construction Industry Press
- Zhao Peipei. Research on design response spectrum fitting methods and characteristic parameter statistics. Institute of Engineering Mechanics, China Earthquake Administration 4.建筑抗震设计规范(GB50011-2010)
Non-decomposition members are being recruited, click here for details: Non-deconstruction | Recruitment of cross-border structural engineers
Past selections: 组合楼盖结构舒适度分析实例 Mutual supporting structure: the structural flower blooming in architecture 超限结构设计(中)-弹性时程分析 盈建科,二次开发 Summary of design examples of one-way tension beam 惊喜!设计院实习两个月,竟成了码农!——小白攻城狮的代码升级之路 The structure is not only the CAD in front of you, but also python and hair!

想详细了解我们,可参阅我们更多公众号文章。 A collection of 100 non-deconstructed original articles

*This document is automatically collected and organized by AI from non-deconstructed public accounts and is for learning reference only. *
LOADING…